NVidia® "Grace" 72 Core Processor Cache Micro-Benchmarks
The gory details of a recent ARM® architecture machine
Introduction
A few years ago I wrote a blog (here) showing the detailed cache properties of the AMD EPYC 7742 64-Core Processor. Since I now have access to the NVidia “Grace” CPU, it seemed worth writing a similar article about that, as it is also a core which will be used in large HPC computing deployments. I have access to this via the University of Bristol and the Isambard-AI project1. Note that at the time of doing these measurements, Isambard-AI is still in an early access phase, though I doubt that any changes will affect these measurements inside a single node!
Although much of the hype surrounding these machines is about the close coupling of the Nvidia “Hopper” GPUs with the “Grace” CPUs, I am only going to discuss the behaviour of the CPU side of the machine, since that is interesting in its own right.
Background
This article will closely parallel the one on the AMD EPYC 7742, using the same benchmarks and the same data-processing flow to generate the graphs. Therefore, if you want to find the code, or scripts, you should consult that article (“AMD® EPYC 7742 64-Core Processor Cache Micro-Benchmarks”). You should also consult that article if you want to do comparison between the two machines. I am not going to make any comparisons here, interesting though they may be!
NVidia Grace CPU
The Grace CPU implementation used here has 72 ARM cores. The cores do not support hyper-threading. Each core has its own, private 64 KiB L1I and L1D caches, with a 1MiB private L2 cache. There is then a shared 117MiB L3 cache in each package (though lstopo thinks there is only 114MiB…). Each node in the machine has four such packages, as shown below by lstopo. More details can be found in “NVIDIA Grace CPU Superchip Architecture In Depth”.
Load/Store Measurements
These are all in loadsStores.cc.
The operation being timed is performed by thread zero and however many other threads are required starting from thread 1 and counting upwards.
Placement
Here I place a cache-line in a known state (modified or unmodified) in a single other core’s cache, and then perform an operation (load, store, atomic increment) from core zero. The idea is to see how the placement of the data affects the operation time. The data here is allocated by thread zero (the active thread).
We can see that, as we should expect :-
loads are faster than stores, which are faster than atomic operations.
accesses inside the socket are faster than those to the L3$ in another socket.
We can also look at the time between each pair of cores. As we would expect from the graph above, this is effectively also a simple way of seeing which cores are in which socket, with everything outside a socket appearing to be equally far away.
Inside the Socket
Since sharing only occurs at the L3$, the difference in access times inside the socket is relatively small, though there is some variation.
Here is a plot showing only at that range (this is the same data as above, just truncated)
We can see that some cores are nearer than others.
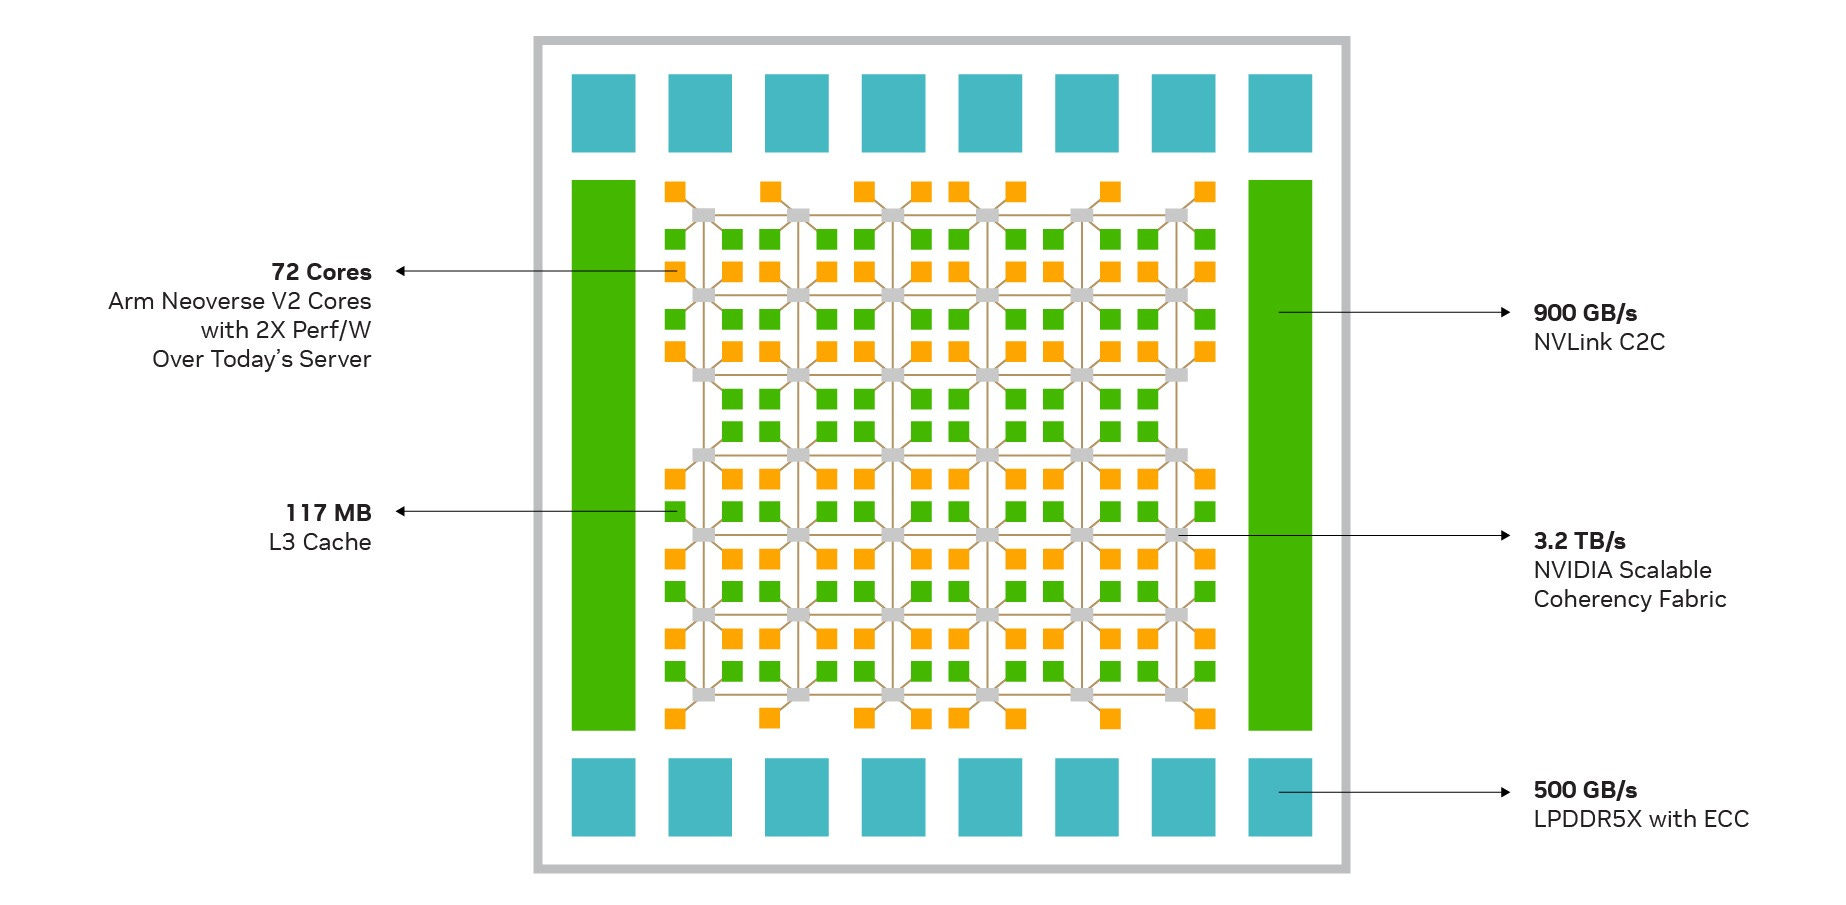
The NVidia article already referenced above shows the layout of CPUs and L3 caches in its figure 3:-
Noting that cores are orange and cache slices green, we can observe that that there are actually 2*8+5*12 = 16+60 = 76 cores and 2*10+5*12 = 20+60 = 80 cache slices. That clearly allows for yield problems because it means that 4 cores can be broken before there is an issue. It is harder to say how many caches can be broken, since the claimed cache-size of 117MiB is a somewhat weird number (3*3*17), but as 117MiB/36 = 3328 KiB, it looks as if each cache-slice is that size. (Although a weird number, 117MiB works better than the 114MiB that lstopo claims, which doesn’t sanely divide at all!) In February 2025, NVidia have updated their online specification information to say that the cache is 114MiB, as lstopo claimed.
What we can see is that
the topology is a 6 by 7 grid (rather than a torus) therefore the maximum separation is 11 hops (from one corner to the other)
as with any grid, CPUs in the centre have better connectivity than those at the edges, having at most 6 hops to the farthest cache or other CPU and its L1 and L2 caches.
there are 8 CPUs (those at the ends of the lines above and below the chunk of caches in the centre of the diagram) which are are only close to one cache slice, whereas all the others are close to two. Since we can only discard four CPUs, at least four of these must be being used.
If we assume that the cores are enumerated in the “obvious” manner from one of the corners of the grid, we can show the theoretically expected number of hops between different points on the grid.
Remembering that each target here represents a pair of cores, we can see that this matches the pattern of the measured data fairly well, confirming that we have a reasonable model of the underlying topology.
Obviously, exactly what performance one will see will depend on the specific set of cores and caches that are enabled on the die on which one is taking measurements, so these results may not align directly with measurements on any other node, even one node in the same machine. They should therefore be treated as representative of what one might see, but not used for immensely detailed placement optimisations of a code.
Outside the Socket
Outside the socket the network seems to be able to make all of the other sockets seem equally far away in terms of latency, though we can still just about make out the repeated hills and valleys that we see (and expect) in the in socket results. These are, of course, much less significant than the baseline inter-socket communication times.
Sharing
Here a line is put into many other cores’ caches (either modified by the first thread and then loaded, or simply loaded by all), and then, as above, we time a single operation on it.
As before, the largest jump here is on leaving a socket. Here, there is a continual gradual increase in the time required for the operations that require the line to be moved into an exclusive state.
Visibility
Here we have many threads polling the same location, and measure the time from a store until the last thread sees the change. This can be viewed as a naive broadcast operation.
There is clearly some noise in these measurements, but the general trends match what one would expect.
Half Round-Trip Time
Here we measure the time it takes for a point-to-point communication to and from a single other core, depending on where that core is. This thus includes a few more things than the simple load/store to a remote line (three times the relevant “write to unmodified single shared remote line”, and a couple of almost certainly mis-predicted branches as the waiting thread leaves the polling loop).
These results are about what we’d expect given the previous ones. Communication inside a socket is ~4x faster than between them, but everything outside is approximately the same distance away.
Atomics
This code is in the atomics.cc file.
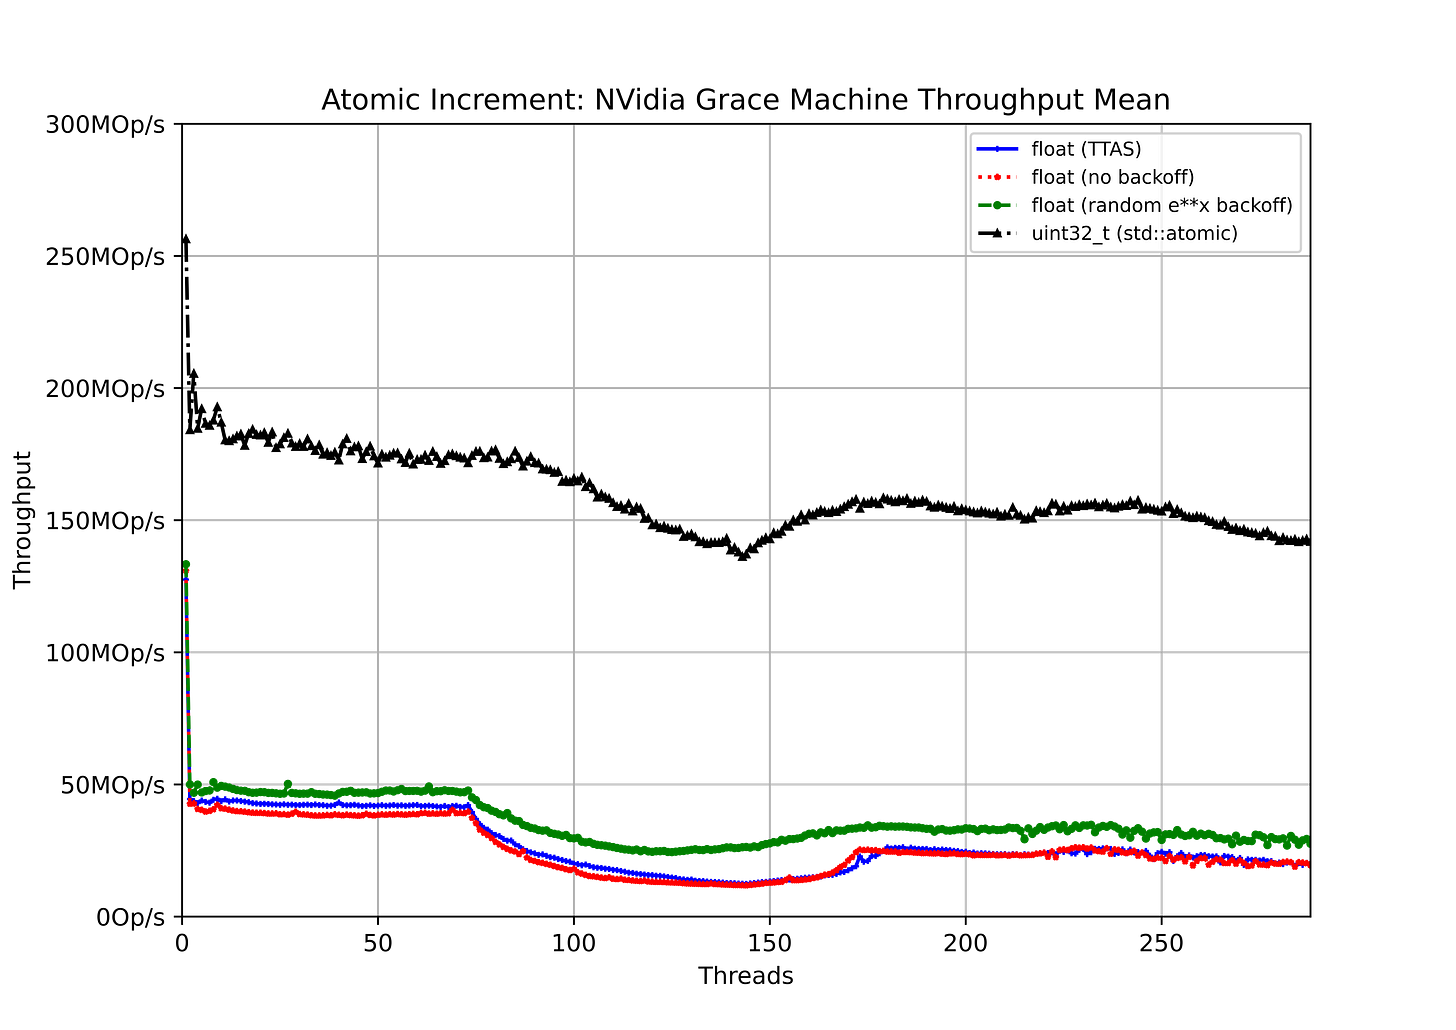
Here I show the total machine throughput for an utterly contended atomic-increment as I increase the number of cores contending for it. Since it is utterly contended, the best we should expect is that the throughput remains constant. (See the discussion in the previous CpuFun blog on Atomics in AArch64 for more on why total machine throughput is the right measure to use.)
The test cases are
Incrementing a float using a “test and test&set” (TTAS) operation for the compare-and-swap (
cmpxchg, std::atomic<>::compare_exchange_strong) operation.Incrementing a
floatusing the simplest code which drops straight into the compare-and-swap.Incrementing a
floatwhile using a random exponential delay if the compare-and-swap fails.Incrementing a
uint32_twhich is handled directly by the C++std::atomic, which should be a single instruction, since the machine has the ARM V8.1-a atomic enhancement, and I have compiled with that enabled.
Again we see what you would expect. The throughput inside a socket is effectively constant; outside it drops off a bit.
Conclusions
This is a machine that, despite its high core-count, is fairly flat. So, the most obvious advice is to try to avoid cross-socket memory accesses (since they take ~5x longer than in-socket ones), and to use a single socket for each MPI process. Since that still gives you 72 cores/MPI process, it may be more than the shared-memory parallelism in your code can reasonably exploit, in which case things get slightly more complicated. However, since the machine also has one GPU/socket, and that is likely to be the main reason to use it, it is unlikely that people will want to run codes that use less than a socket.
If you do want to run CPU-only codes with fewer cores/MPI process than a socket, then the obvious sub-divisions are into two processes each with 36 cores, or four processes each with 18 cores. When splitting into two, since the coherence grid is approximately square, a simple sequential allocation of cores (process 0 gets cores 0:35, process 1 gets cores 36:71) is fine.
However, when splitting into four, the trivial sequential split is somewhat suboptimal, since (remembering that we have two cores close to each grid access point), we have 9 access points for 18 cores, but would be allocating a slice like this
which has a maximum distance of 6 hops and mean distance of 2.74 rather than a 3x3 grid which has a maximum distance of 4, and mean of 1.96. It would therefore potentially be better to use more complicated subsets of the cores for each process i.e [0:5,12:17,23:28] for the first process, [6:11,18:23,29:35] for the second, etc…
Acknowledgements
This work used the Isambard-AI machine (in its testing phase), for which thanks are due to Bristol University and the Bristol Centre for Supercomputing.
Thanks to Brice Goglin and his team for hwloc.


